Design of an Air Flow Sensor Board: From Analog to Digital
As part of the UE “Analog – digital sensors and interfaces” in L2 EEA at Sorbonne University, I had the opportunity to design a complete air flow detection system with my partner, Abdelhafidh Haloui.
The objective of this mini-project was simple on paper, but rich in technical challenges: determine the direction of an air flow in a tube using analog components, process this signal, then digitize it to display it in a readable manner..
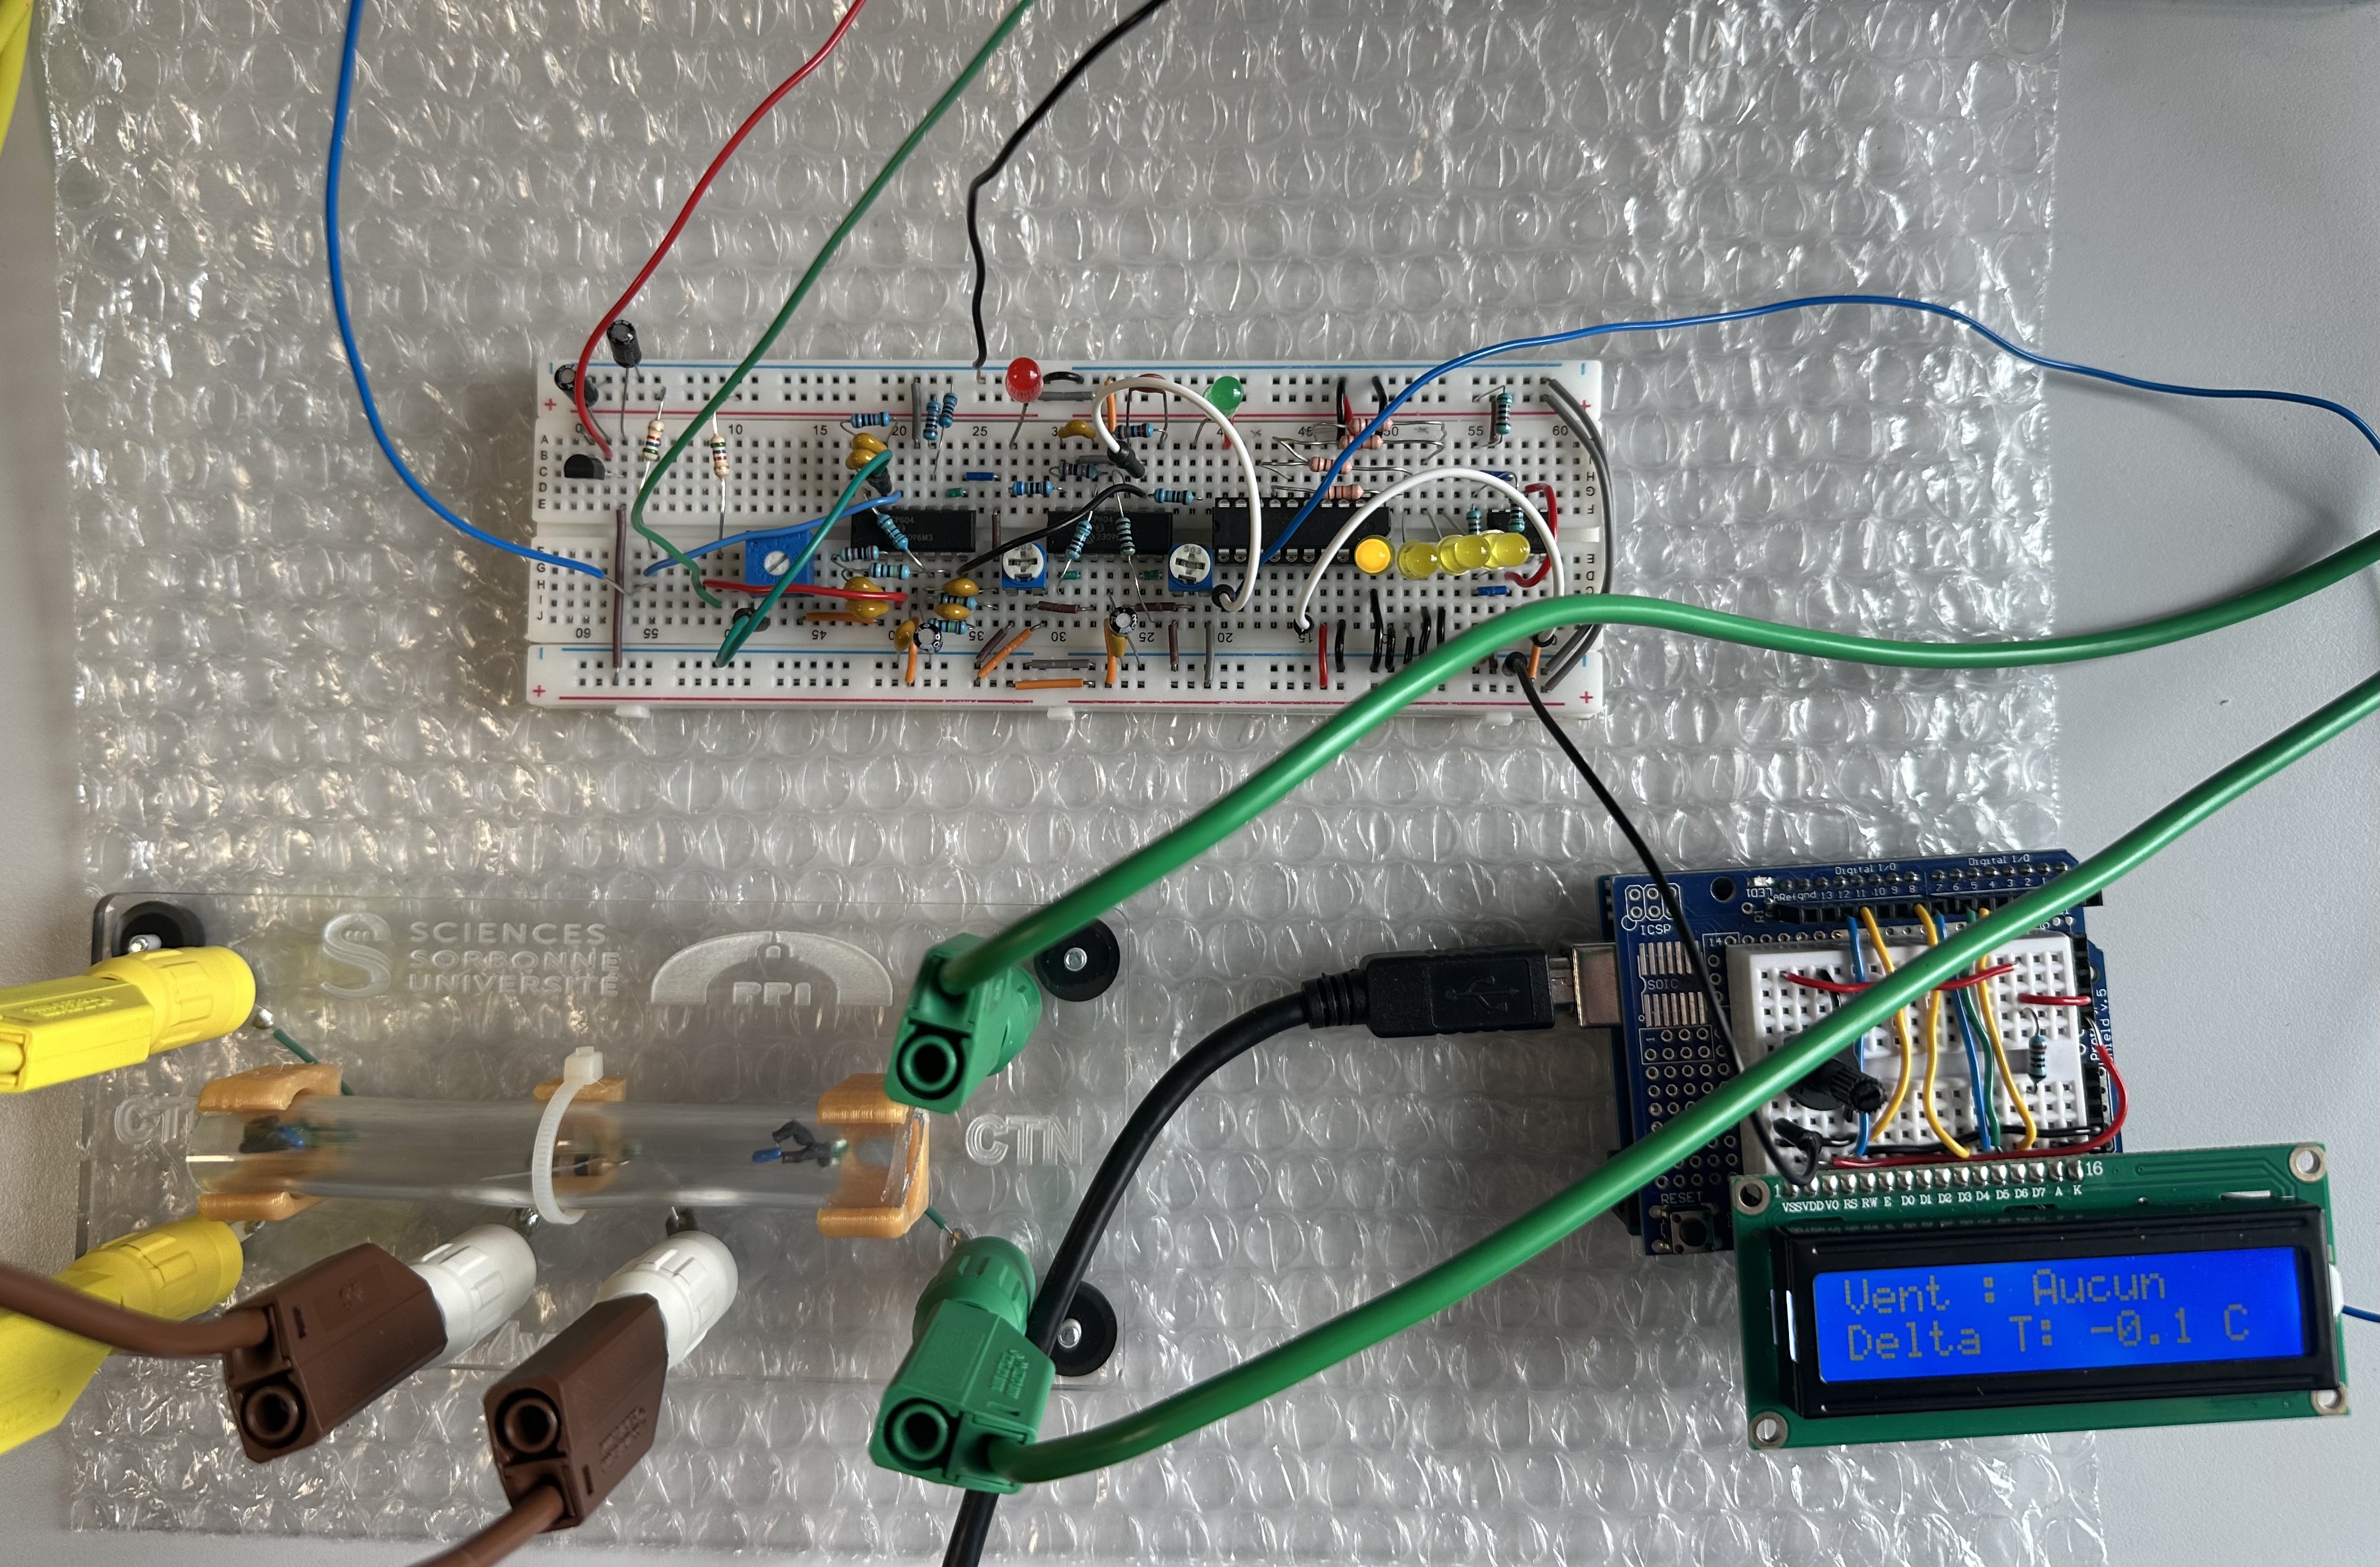
Here is a behind-the-scenes look at our assembly, from physical measurement to display on LCD screen.
1. The Heart of the Sensor: Physical Measurement
To detect the wind we used two thermistors CTN 151-221 placed in the tube. The principle is based on temperature variation: the air dissipates heat differently on the two sensors depending on its direction.
To exploit this tiny variation, the CTNs are mounted in a half-bridge Wheatstone Bridge. This assembly makes it possible to translate the temperature difference between the two sensors into a small usable voltage difference.
2. Signal Conditioning
The signal coming out of the Wheatstone Bridge is raw, weak and noisy. This is where the conditioning part comes in, brilliantly accomplished by my partner:
- Amplification : We applied a voltage gain of 6.9 to make the potential difference measurable subsequently.
- Anti-parasite Filtering : The electronic environment (especially the 230V sector at 50Hz) generates a lot of noise. We have therefore integrated a second-order low-pass filter with a cut-off frequency set at 39 Hz. This effectively eliminates mains disturbances.
- Comparison : The amplified signal is then sent to comparators to display the wind direction on one of the 2 LEDs.
Indication of the direction of flow is done very intuitively:
- The flow from Left to Right lights a Red LED.
- The flow from Right to Left lights a Green LED.
- In the absence of flow, both LEDs remain off.
3. Data Digitization
Once the analog signal was clean and amplified, my mission was to digitize it. Our specifications required us to use a ADC08020 (8 bits).
The idea was to display the voltage converted to binary on a chase of 4 yellow LEDs, using the 4 least significant bits (LSB) or high depending on the desired resolution.. The output resolution of our ADC Flash is 4 bits.
4. The Bonus: Arduino Integration & LCD Screen
To go further, I decided to connect our circuit to a Arduino UNO R3 as well as an LCD screen 1602. In order to display the wind direction and the Delta T temperature difference.
Software Processing and Anti-Bounce
In the Arduino code, I implemented "Debounce" logic on the digital pins reading the state of the comparators. The program requires reading the same state 10 times before validating a change in wind direction, guaranteeing a perfectly stable display on the LCD.
Mathematics and System Limits
The analog voltage read by the Arduino is converted into temperature thanks to the sensitivity of our assembly, which is 0.346 V/ºC. The transfer formula of our system is as follows:
Delta T = (Vout – 2.5) * 2.89
Why a limit of ±7.225 ºC? The Arduino UNO R3 can only read a maximum voltage of 5V on its analog pins. If we had a Delta T of ±20ºC, the theoretical output voltage would be 9.3V(0.34 * 20 + 2.5). Therefore, to avoid frying the card input and saturating the reading at 5V, our maximum measurable Delta T is mathematically limited to ±7.225 ºC.
5. MATLAB modeling: Visualization of the Delta T curve
To go further in the mathematical analysis of our system, I also developed a script on MATLAB in order to plot and display the voltage evolution curve as a function of the temperature difference (ΔT). Coding this modeling allowed us to better visualize the dynamic behavior of our sensor and to graphically confirm our theoretical calculations. It is also this curve which perfectly illustrates our detection limit: we can clearly see that in order not to exceed the maximum voltage of 5V tolerated by the analog inputs of the Arduino, our measurable ΔT must be limited to 7,225 °C.
6. Technical Specifications and Budget
Here is a summary of the characteristics of our final map:
- Circuit dimensions : 80 cm².
- DC consumption : Between 126 mW and 226 mW (excluding heating resistor).
- Sensitivity : 0.346 V/ºC.
- Measuring range: Delta T : From ±1 ºC (minimum detection) to ±7.225 ºC (maximum).
- Uncertainty about Delta T : ±0.25 ºC (or 0.0865 V).
- Total cost of the prototype : 23.916 $.
This project was an excellent opportunity to marry precision analog electronics with digital processing by Arduino. The synergy with my partner, which was decisive, made it possible to obtain a reliable, stable sensor whose data is easily interpretable. He does a lot of electronics and is very passionate, do not hesitate to contact him on his Linkedin I leave you attached the date of the project! Datasheet, and I leave you my link at the ISIR to follow my progress there!